Graphical Editor
Dyad has both a text-based and a graphical editor. The text-based interface is discussed primarily in the syntax section, and we discuss the graphical editor here. This is also sometimes called the "diagram layer".
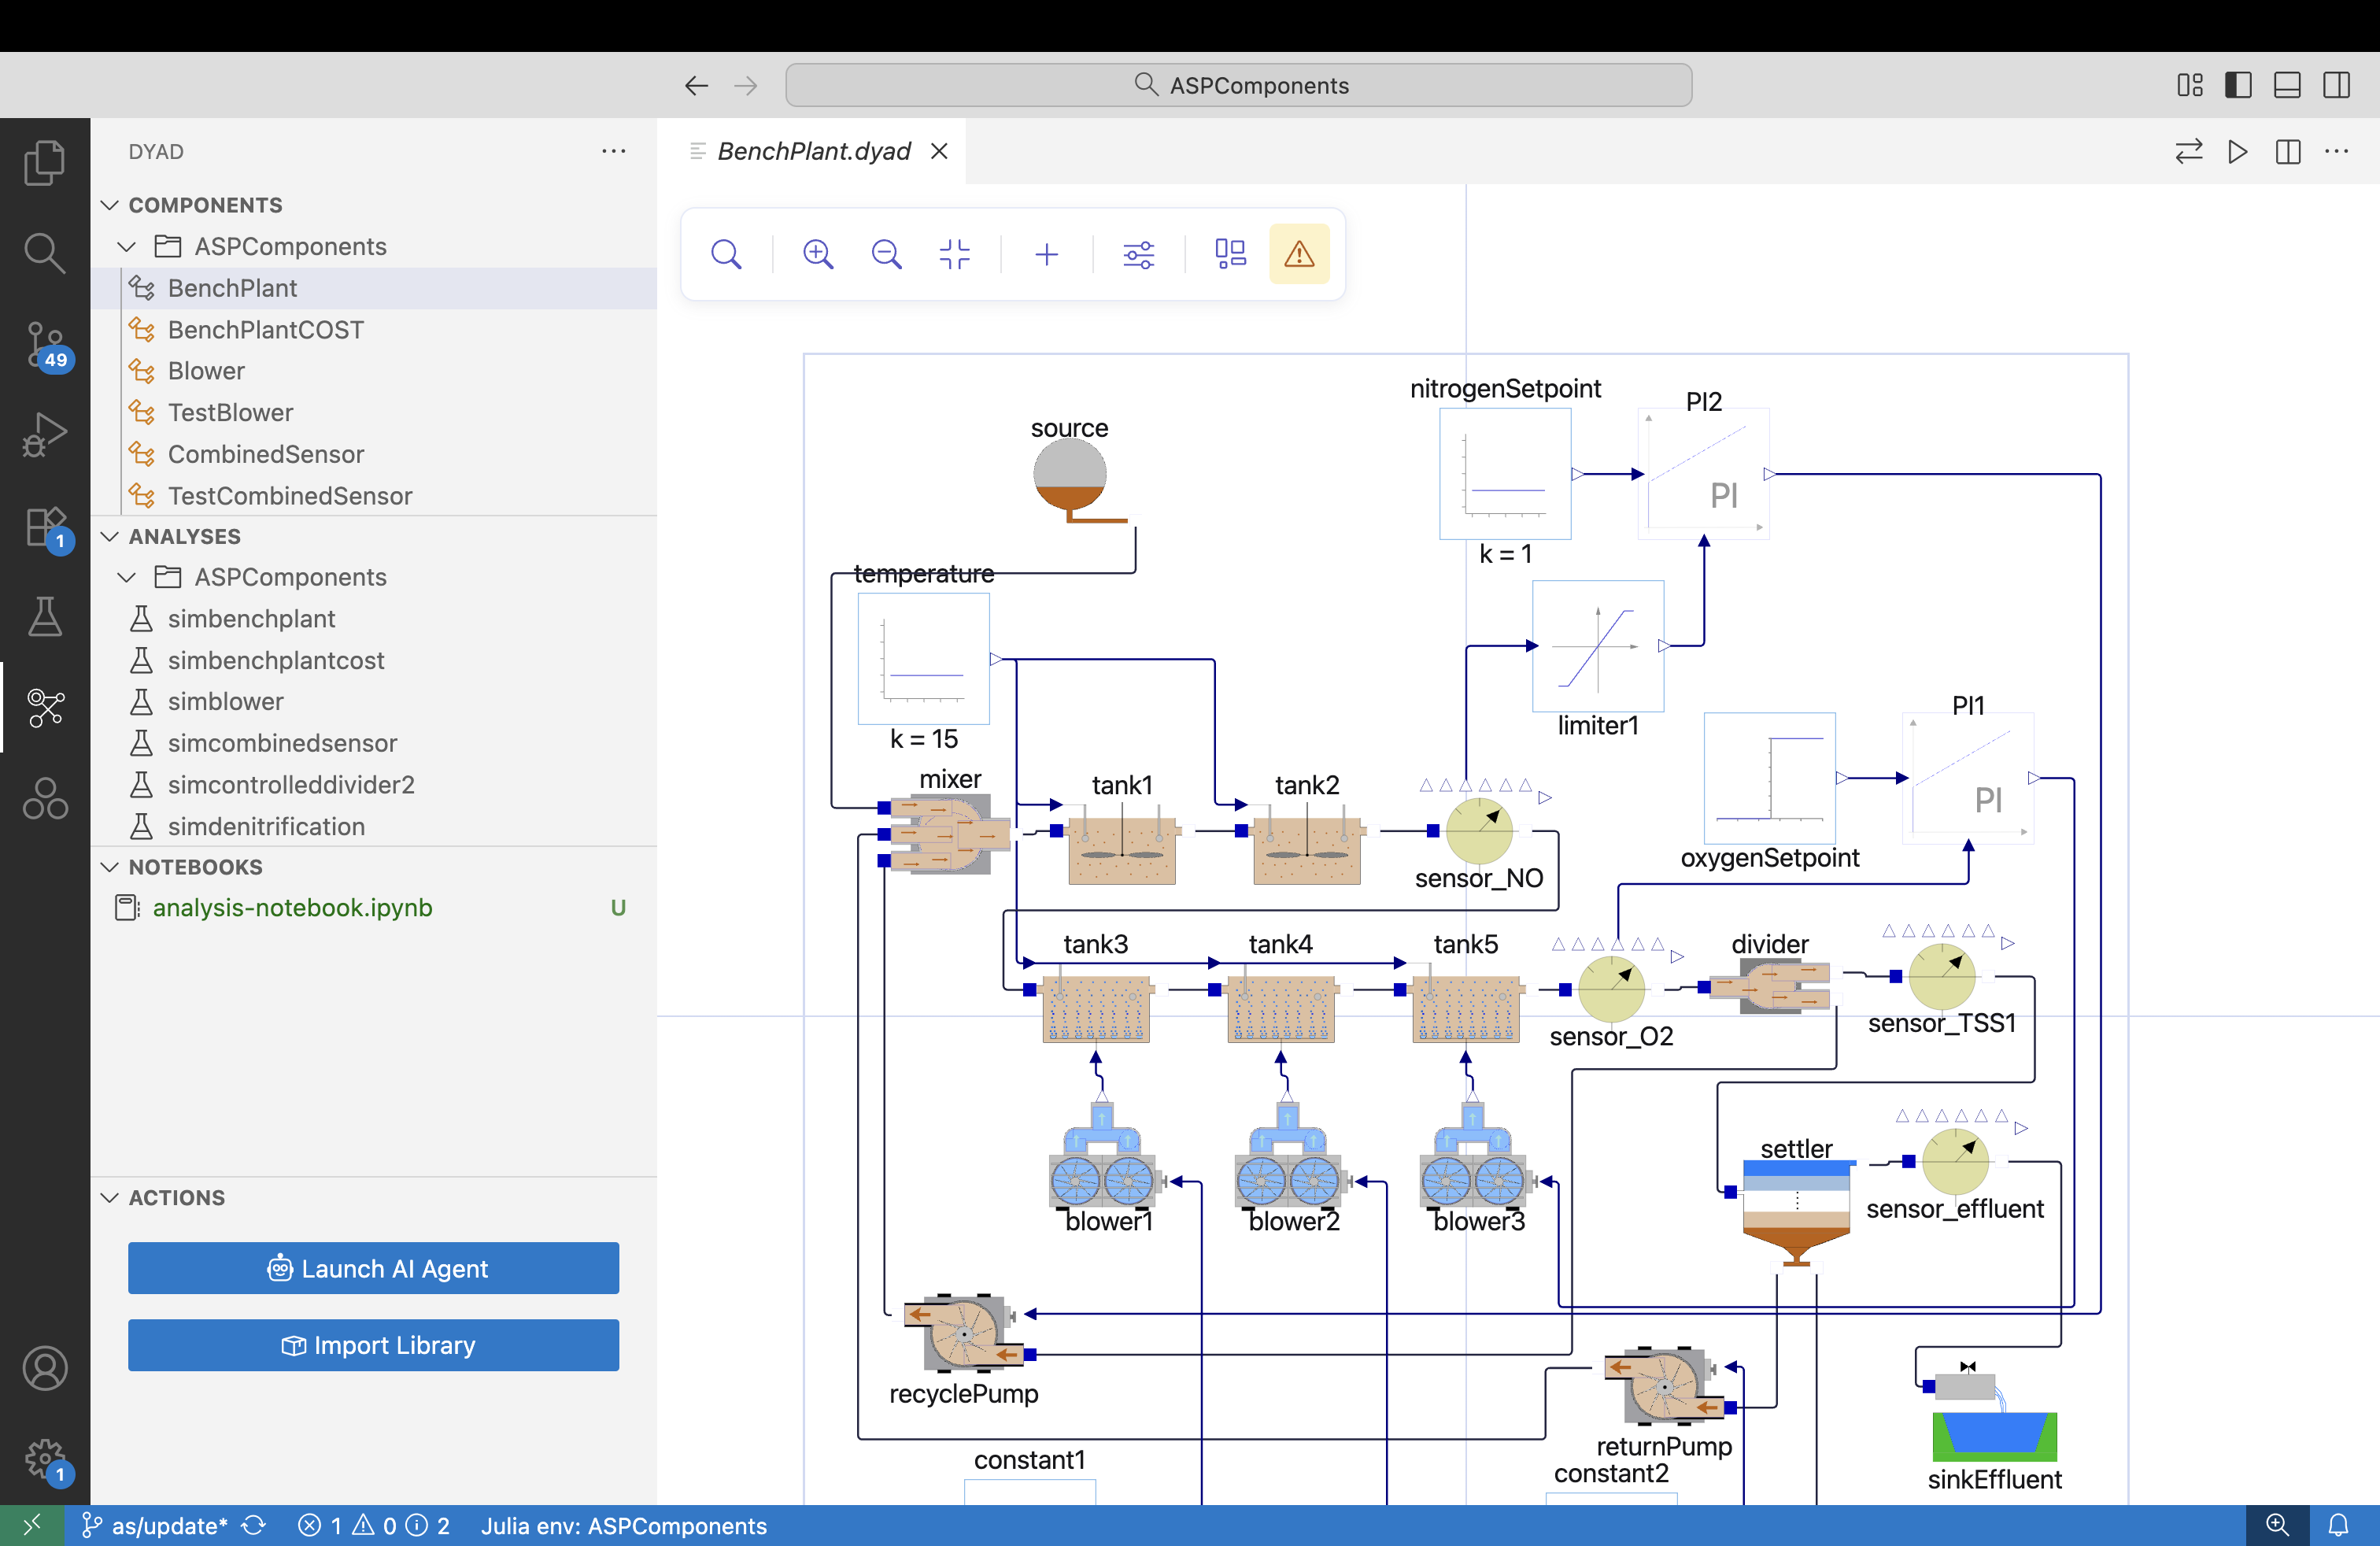
The graphical editor in Dyad allows you to build and manipulate your models visually. Click on any region of the screenshot below to learn more about it.
You can launch it by either clicking on the "Render Diagram" button on top of any Dyad component: 
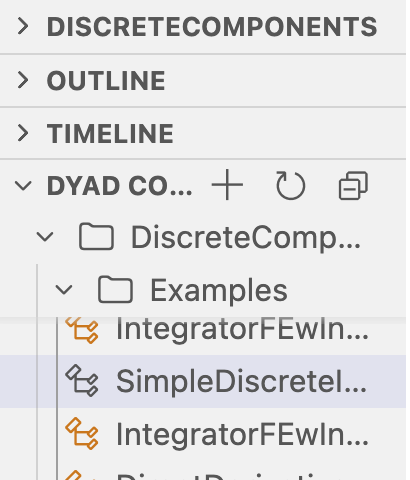
or by clicking on a component in the "Dyad Components" view at the bottom of the left sidebar, where you would normally see your files:
Components View
The Components view in the left sidebar shows all Dyad components in your current project. You can expand folders to see the component hierarchy, and click on any component to open it in the graphical editor.
Analyses View
The Analyses view shows all simulation analyses defined in your project. Each analysis corresponds to a simulation configuration that can be run against your model.
Notebooks View
The Notebooks view lists Jupyter notebooks associated with your project. These notebooks can be used for post-processing simulation results, scripting, and exploratory analysis.
Actions View
The Actions view provides quick-access buttons for common operations, including launching the AI Agent and importing component libraries into your project.
Controls
With a mouse:
Left-click to select, drag to move.
Click the scroll wheel (middle mouse button) and drag to pan
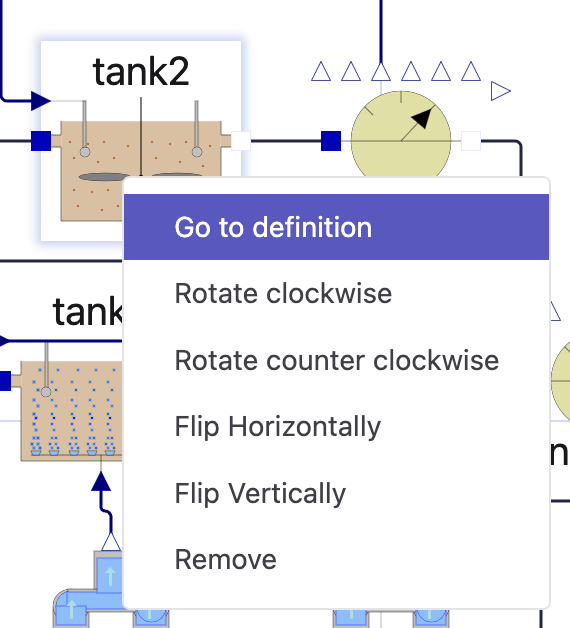
Right-click:
On the canvas: add a label
On a component: opens the component context menu
Ctrl+S to save the current state of the component
Ctrl+Z to undo the last action
Ctrl+Y to redo the last action
Editing a Component
The Top Bar
In the graphical editor, there is a bar at the top left of the window. This is the "top bar", which contains a number of buttons and controls that allow you to edit your model.
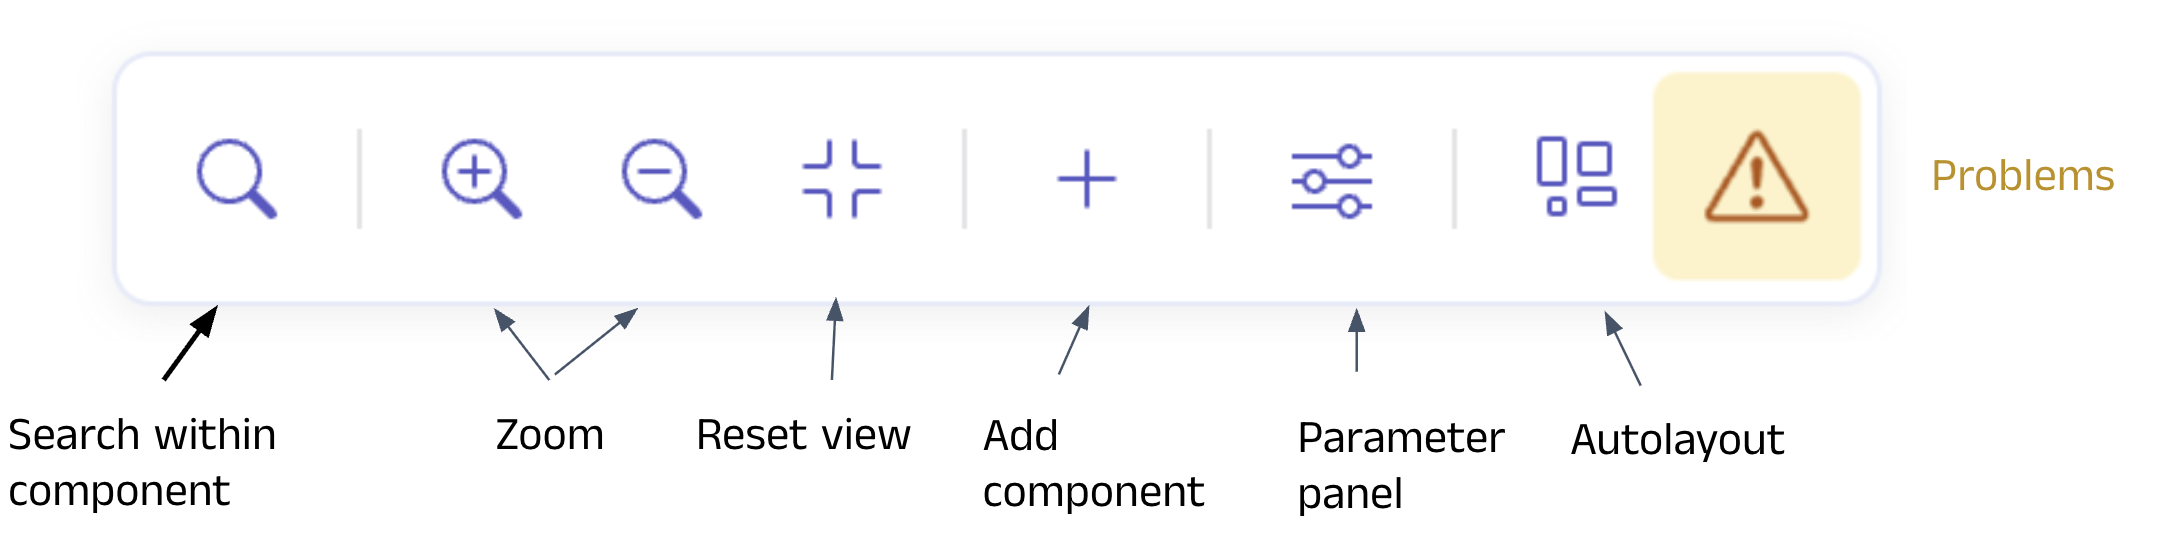
We'll go through each of these buttons in detail below.
Search Within Component

This button allows you to search in the current component's hierarchy for a given name (that could be the name of a subcomponent, variable, parameter, etc.).
Each component is shown with its icon and name, and then the bullet points below it are its parameters, variables and connector names that match the search.
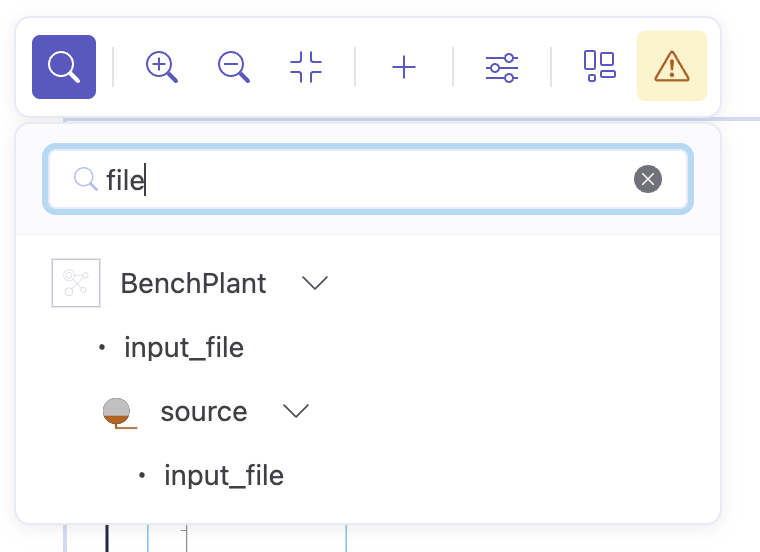
You can see here that by searching for "file", it shows all parameters/variables whose name contains "file". Names inside subcomponents (or subcomponents of subcomponents, etc.) are also searched and appear indented in hierarchical order.
Zooming / Reset View

Add Component
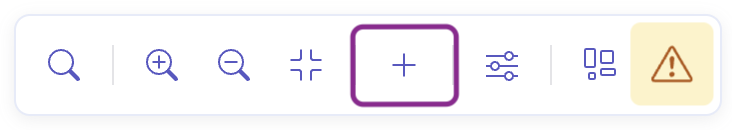
Add a (sub-)component to your current component. You can search for components by name, or browse through the available components in your current project and all available component libraries.
Parameter Panel
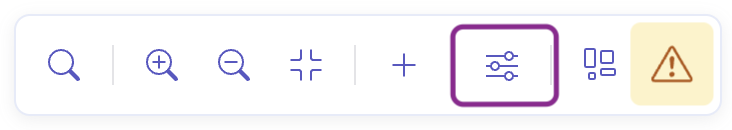
Open the parameter panel to view and edit parameter values for the selected component. If no component is selected, then the parameter panel will show the parameters for the current component whose structure is being viewed.
You can update values directly in the panel, and use the Add Parameter button at the bottom to create a new parameter. Newly added parameters must be used from the text view.
Autolayout
Pressing this button will automatically arrange components and connections in the current diagram.
Autolayout is currently all-or-nothing, so running it reapplies the full layout and will overwrite manual layout changes you have made. Bear in mind that autolayout is not perfect and you may need to do a lot of manual tweaking.
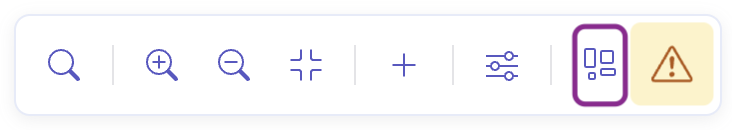
Problem Panel
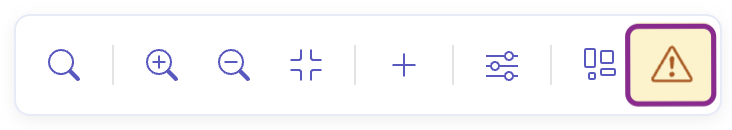
The problem panel shows all of the Problems and warnings in your current component. Problems are issues that the Dyad compiler has found in your model, which you may need to address.