Introduction
This section provides an overview of the visualization capabilities of JuliaSimSurrogates. The Visualisations module needs to be used in tandem with the DataGeneration module. The DataGeneration module provides the capability to generate data for training the surrogate model. The Visualisations module provides the capability to tune controllers required for data generation and visualize the data generated.
Loading the dataset
We will load a pre-generated dataset for using it to demonstrate the usage.
using JuliaHub, JLSO, DataGeneration, Visualisations, CairoMakietrain_dataset_name = "lotka_volterra"
path = JuliaHub.download_dataset(("juliasimtutorials", train_dataset_name), "path to save")ed = ExperimentData(JLSO.load(path)[:result]) Number of Trajectories in ExperimentData: 10
Basic Statistics for Given Dynamical System's Specifications
Number of u0s in the ExperimentData: 2
Number of ps in the ExperimentData: 4
╭─────────┬────────────────────────────────────────────────────────────────────╮
│ Field │ │
├─────────┼────────────────────────────────────────────────────────────────────┤
│ │ ╭────────────┬──────────────┬──────────────┬────────┬──────────╮ │
│ │ │ Labels │ LowerBound │ UpperBound │ Mean │ StdDev │ │
│ │ ├────────────┼──────────────┼──────────────┼────────┼──────────┤ │
│ │ │ states_1 │ 1.0 │ 1.0 │ 1.0 │ 0.0 │ │
│ u0s │ ├────────────┼──────────────┼──────────────┼────────┼──────────┤ │
│ │ │ ⋮ │ ⋮ │ ⋮ │ ⋮ │ ⋮ │ │
│ │ │ ⋮ │ ⋮ │ ⋮ │ ⋮ │ ⋮ │ │
│ │ ├────────────┼──────────────┼──────────────┼────────┼──────────┤ │
│ │ │ states_2 │ 1.0 │ 1.0 │ 1.0 │ 0.0 │ │
│ │ ╰────────────┴──────────────┴──────────────┴────────┴──────────╯ │
├─────────┼────────────────────────────────────────────────────────────────────┤
│ │ ╭──────────┬──────────────┬──────────────┬─────────┬──────────╮ │
│ │ │ Labels │ LowerBound │ UpperBound │ Mean │ StdDev │ │
│ │ ├──────────┼──────────────┼──────────────┼─────────┼──────────┤ │
│ │ │ p_1 │ 1.562 │ 2.438 │ 1.969 │ 0.302 │ │
│ ps │ ├──────────┼──────────────┼──────────────┼─────────┼──────────┤ │
│ │ │ ⋮ │ ⋮ │ ⋮ │ ⋮ │ ⋮ │ │
│ │ │ ⋮ │ ⋮ │ ⋮ │ ⋮ │ ⋮ │ │
│ │ ├──────────┼──────────────┼──────────────┼─────────┼──────────┤ │
│ │ │ p_4 │ 1.766 │ 1.984 │ 1.87 │ 0.074 │ │
│ │ ╰──────────┴──────────────┴──────────────┴─────────┴──────────╯ │
╰─────────┴────────────────────────────────────────────────────────────────────╯
Basic Statistics for Given Dynamical System's Continuous Fields
Number of states in the ExperimentData: 2
╭──────────┬─────────────────────────────────────────────────────────────────...
──╮...
│ Field │...
│...
├──────────┼─────────────────────────────────────────────────────────────────...
──┤...
│ │ ╭────────────┬──────────────┬──────────────┬─────────┬─────────...
│ │ │ Labels │ LowerBound │ UpperBound │ Mean │ StdDev...
│ │ ├────────────┼──────────────┼──────────────┼─────────┼─────────...
│ │ │ states_1 │ 0.61 │ 1.851 │ 1.131 │ 0.294...
│ states │ ├────────────┼──────────────┼──────────────┼─────────┼─────────...
│ │ │ ⋮ │ ⋮ │ ⋮ │ ⋮ │...
│ │ │ ⋮ │ ⋮ │ ⋮ │ ⋮ │...
│ │ ├────────────┼──────────────┼──────────────┼─────────┼─────────...
│ │ │ states_2 │ 0.585 │ 1.93 │ 1.068 │ 0.272...
│ │ ╰────────────┴──────────────┴──────────────┴─────────┴─────────...
╰──────────┴─────────────────────────────────────────────────────────────────...
──╯...
Phase Space Plots
The Visualisations module provides a function to generate phase plots of the data, which can be used to analyze the exploration and exploitation of the observable and control space.
See the plot_phase_space function for more details.
Example
fig, ax = plot_phase_space(ed, :states)
fig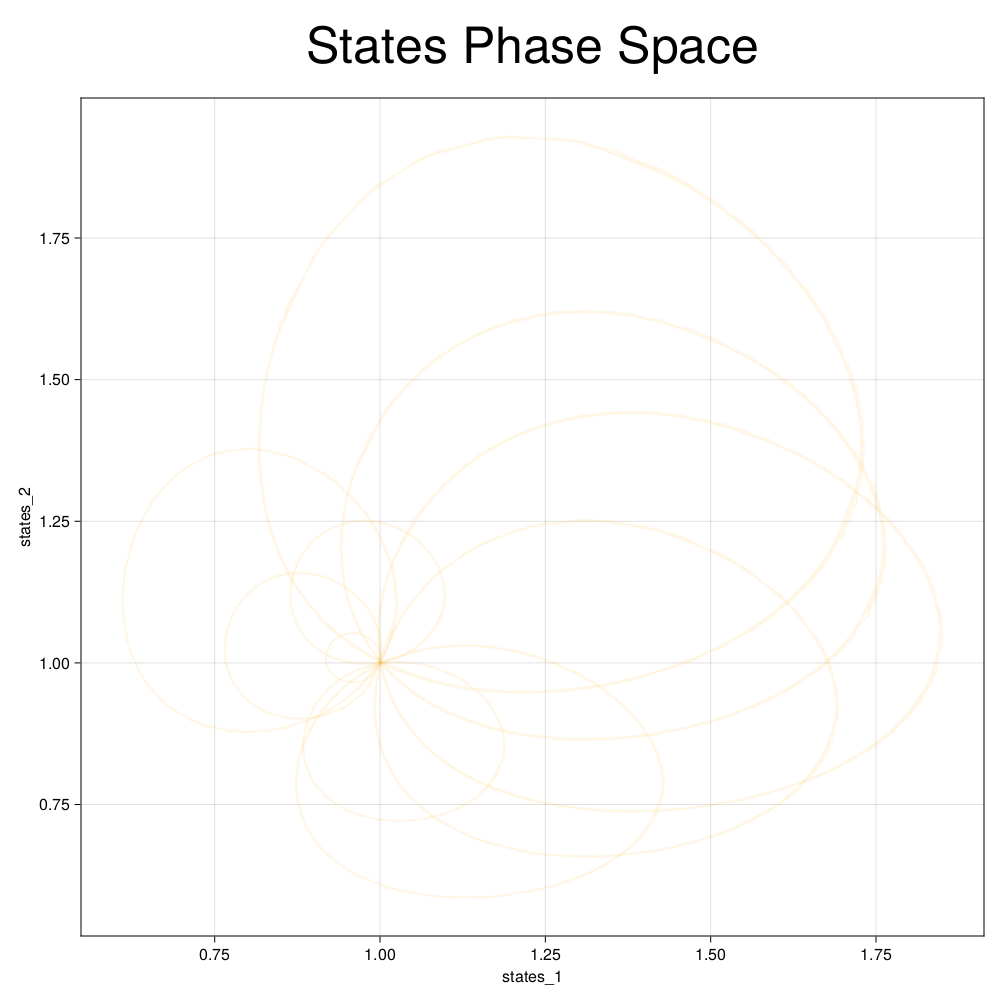
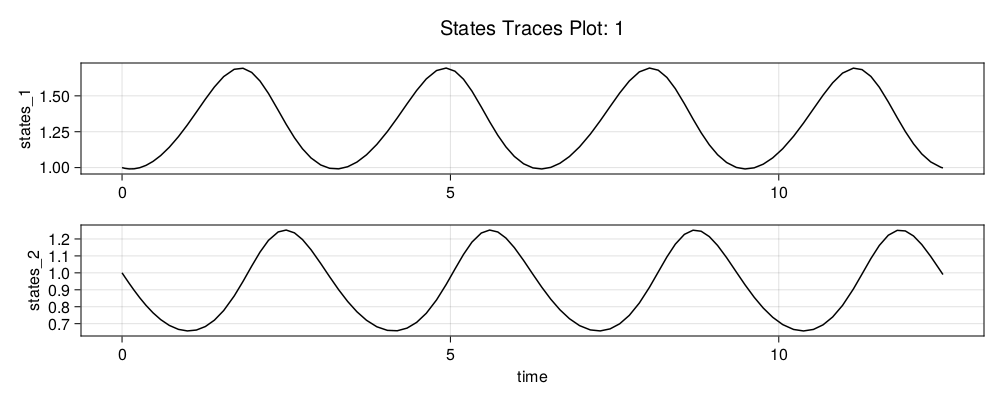
Trace Plots
The Visualisations module provides a function to generate trace plots of the data, which can be used to analyze the qualitative nature of the data generated. This sort of plots helps the user to check if the simulated traces are not noisy or if the controller is saturated and is not able to explore the state space.
See the plot_traces function for more details.
Example
plot_traces(ed, 1; var_type=:states)